
 29.01.2025 04:54 AM
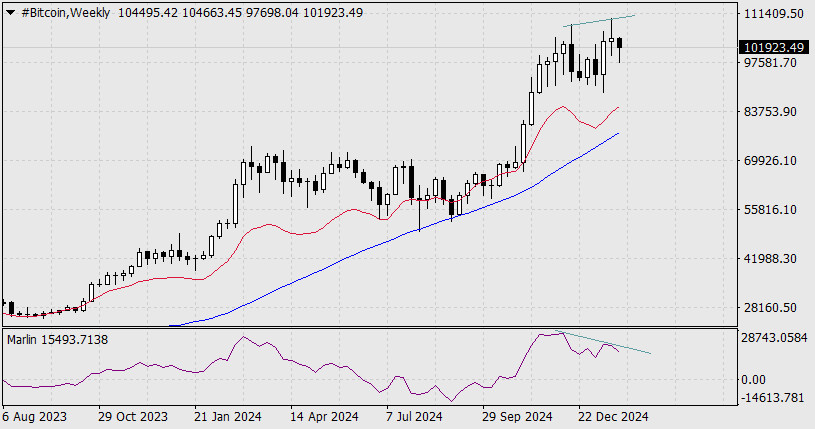
على الرسم البياني الأسبوعي، هناك تباين واضح بين السعر ومذبذب Marlin. هذا التباين لديه إمكانات كبيرة؛ إذا لم يؤدِ إلى انعكاس كامل، فقد يؤدي على الأقل إلى تصحيح يستمر من 2 إلى 3 أسابيع.
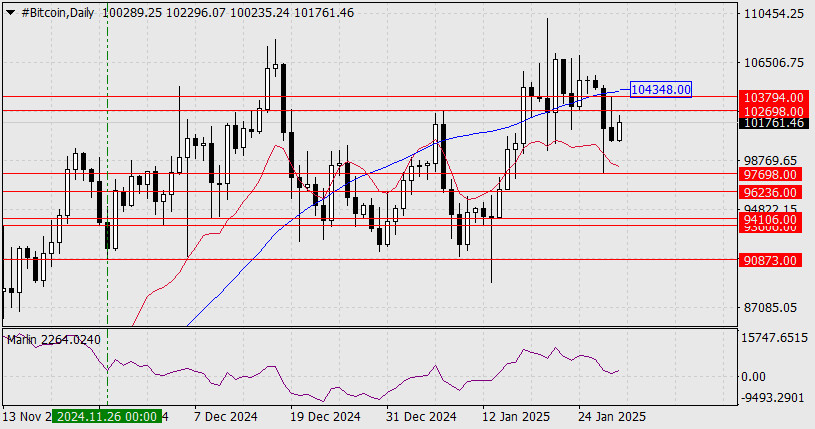
على الرسم البياني اليومي، استقرت الأسعار تحت خط MACD، ويحاول مؤشر Marlin الدخول إلى منطقة الاتجاه الهابط. الأهداف المتوقعة للانخفاض هي كما يلي: 97,698، 96,236، 93,606–94,106، و90,873، وهو أدنى مستوى منذ 26 نوفمبر.
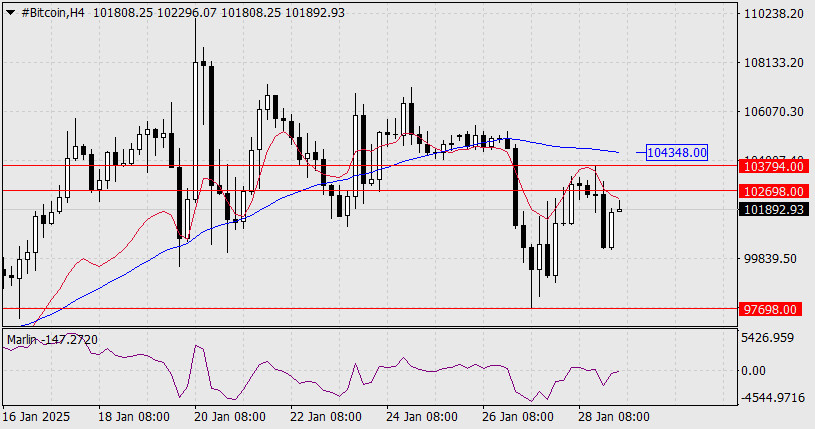
قد يحدث تحرك صعودي إذا اخترق السعر فوق خط MACD عند حوالي 104,348. على الرسم البياني لأربع ساعات، يبقى السعر تحت خط التوازن (المتوسط المتحرك الأحمر) ويستقر تحت مستوى 102,698، وهو أعلى مستوى في 7 يناير. وقد عزز مؤشر Marlin موقعه في المنطقة الهابطة.
الأهداف الأقرب لانخفاض البيتكوين هي 97,698 و96,236. وعلى العكس، يمكن أن يتطور سيناريو صعودي بديل إذا اخترق السعر مستوى 103,794 وخط MACD عند 104,348. ومن الجدير بالذكر أن خطوط MACD على الرسوم البيانية H4 واليومية تتطابق، مما يعزز من قوة مستوى المقاومة هذا.
You have already liked this post today
*The market analysis posted here is meant to increase your awareness, but not to give instructions to make a trade.
على الرسم البياني الساعي، ارتد زوج الجنيه الإسترليني/الدولار الأمريكي يوم الخميس من منطقة المقاومة 1.3611–1.3633 واستأنف انخفاضه نحو مستوى فيبوناتشي 127.2% عند 1.3527. الارتداد من هذا المستوى سيعزز الجنيه الإسترليني
XAU/USD، الجمعة، 11 يوليو 2025. على الرغم من أنه يبدو أنه قد تم تصحيحه بسبب توقفه عند المقاومة 1، إلا أن القوة المستمرة للظروف الفنية والأساسية لـ XAU/USD توفر فرصة
على الرسم البياني لكل ساعة، واصل زوج الجنيه الإسترليني/الدولار الأمريكي حركته الصعودية يوم الأربعاء بعد الارتداد من مستوى التصحيح 127.2% فيبوناتشي عند 1.3527. كان الارتداد دقيقًا، مما أدى إلى انعكاس
يوم الخميس، يستعيد زوج الجنيه الإسترليني/الين الياباني الزخم الصعودي ويظهر استعدادًا لمزيد من النمو. يؤكد تشكيل قناة صاعدة على استقرار الاتجاه الصعودي. خلال الجلسة الآسيوية، أصبح المشترون أكثر نشاطًا بالقرب
USD/CHF، الخميس، 10 يوليو 2025 بالإضافة إلى الشائعات حول تخفيض محتمل في سعر الفائدة من قبل الفيدرالي وانخفاض عوائد السندات الحكومية الأمريكية، ضعف زوج USD/CHF اليوم. المستويات الرئيسية 1. المقاومة
إشعارات
عبر البريد الإلكتروني والرسائل القصيرة

Your IP address shows that you are currently located in the USA. If you are a resident of the United States, you are prohibited from using the services of InstaFintech Group including online trading, online transfers, deposit/withdrawal of funds, etc.
If you think you are seeing this message by mistake and your location is not the US, kindly proceed to the website. Otherwise, you must leave the website in order to comply with government restrictions.
Why does your IP address show your location as the USA?
Please confirm whether you are a US resident or not by clicking the relevant button below. If you choose the wrong option, being a US resident, you will not be able to open an account with InstaTrade anyway.
We are sorry for any inconvenience caused by this message.


